


Chief Financial Officer's performance overview
In 2018, Sasol delivered a strong underlying cash flow performance, underpinned by higher sales volumes and much higher crude oil and product margins especially during the second half of the year. We continued to see strong demand for our chemical products, which contributed to this resilient cash earnings performance.
Oil prices improved to US$64 per barrel on average in 2018, compared to US$50 per barrel in the prior year, with prices forecast to trend between US$65 and US$75 per barrel in 2019. Oil markets remain exposed to shifts in geopolitical risks as well as supply and demand movements. This oil price range will position us very well to grow future earnings.
The higher oil price and stronger demand for product, particularly in the Performance Chemicals portfolio has resulted in higher chemical prices. Base chemicals dollar basket prices increased by 12% and the Performance Chemicals dollar basket price increased by 8% which positively impacted on our margins. Fuel and energy products prices increased broadly in line with higher dollar based oil prices.
During 2018, the rand/US dollar exchange rate averaged R12,85 compared to R13,61 for the prior year. The stronger average rand/US dollar exchange rate significantly impacted on the results of our Chemicals businesses as a significant portion of their business is exposed to foreign currency sales and capital expenditure. We do remain cautious with regards to the impact of a volatile rand/US dollar exchange rate on our business going forward. To mitigate against these risks, we are of the view that our hedging programme is a key component of our financial risk management framework to provide certainty as we manage peak gearing and ensure sufficient liquidity for the company. We intend to continue with a prudent hedging strategy following our peak gearing, to ensure effective balance sheet management and to protect cash flows needed to execute on our value based strategy. We are pleased that our hedging programme relating to oil and rand/US dollar cover for 2019 is now complete.

EBITDA up 10%
Core headline earnings R36,03 reflects sustainable operations
Maintained
investment
grade credit rating
Capital expenditure R53,4 bn
“ Focusing on managing the balance sheet and improving cash generation through a disciplined capital allocation approach” Paul Victor

Key drivers impacting our results
Sasol’s integrated risk management process has enabled us to remain resilient in the volatile macroeconomic environment. We closely monitor the progress of our strategic objectives by considering and planning for various likely financial scenarios in determining whether the risk is within the limits of our risk tolerance and risk appetite as well as testing the robustness of our mitigation actions. In order to assess the impact of the operating environment on our business, it is important to understand those factors that affect the delivery of our results.
| RISK | IMPACT ON VALUE CREATION | RESPONSE | ||
| CREDIT MARKET RISK AND ITS IMPACT ON OUR DEBT PROFILE |
|
|
||
| VOLATILE MARKETS AND EXCHANGE RATES |
|
|
||
| CRUDE OIL |
|
|
||
| CHEMICAL PRICES |
|
|
||
| GAS PRICES |
|
|
||
| EXECUTING ON CAPITAL PROJECTS |
|
|
||
| OUR COST BASE |
|
|
Overview of financial performance
Earnings attributable to shareholders for the year ended 30 June 2018 decreased by 57% to R8,7 billion from R20,4 billion in the prior year. The stronger average rand/US dollar exchange rate and the negative impact of remeasurement items, largely driven by the stronger longer-term rand exchange rate, resulted in a much lower profit and earnings per share for the year.
Our underlying cash flow performance was robust. Earnings before interest, tax, depreciation and amortisation (EBITDA) increased by 10% when compared to the prior year. Core headline earnings per share (CHEPS) however decreased by 6% to R36,03 compared to the prior period and headline earnings per share decreased by 22% to R27,44. The difference between core headline earnings and EBITDA in the current year is largely due to depreciation of approximately R16 billion and employee share-based payment expenses of R1,5 billion due to the marked improvement of the Sasol share price at the end of the financial year. The share-based payment relating to our Khanyisa Broad- Based Black Economic Empowerment (B-BBEE) transaction of R3 billion is excluded from core headline earnings and EBITDA as it is considered to be a once-off and non-cash item.
The Sasol Limited Board (“the Board”) considers core headline earnings as an appropriate indicator of the sustainable operating performance of the Group.
| Refer to inside back cover for definition of core headline earnings. |
Earnings attributable to shareholders (R billion)

Headline earnings per share (Rand per share)
Core headline earnings per share (Rand per share)

Earning before interest and tax – price volume variance analysis

Once-off items includes an impairment of R5,2 billion on our South African Chlor Vinyls cash generating unit, as a result of the continued and sustained strengthening of the exchange rate outlook and the resulting impact on Base Chemicals margins. The valuation of the Production Sharing Agreement (PSA) was impacted by weaker long-term macroeconomic assumptions and lower than expected oil volumes. This resulted in a partial impairment of R1,1 billion (US$94 million), we impaired our Canadian shale gas assets by R2,8 billion in the first half of the year due to a further decline in long-term gas prices and we scrapped our US GTL project amounting to R1,1 billion (US$83 million).
Sasol experienced some challenges with regards to our operational performance during the year, largely due to planned and unplanned production interruptions at SSO, Natref and Mining which impacted production and sales volumes across the value chain. Despite these interruptions, we delivered a stronger overall operational performance in the second half of the year. Our production run-rates during the fourth quarter of financial year 2018, on an annual average basis, supports our internal targeted run-rates.
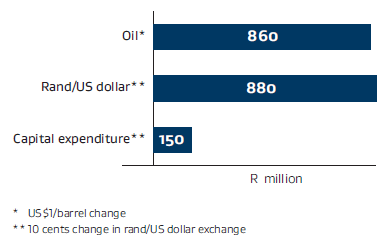
Key sensitivities impacting our profitability
Sales volumes increased by 1% for our Performance Chemicals business spurred by robust market demand despite Eskom electricity supply interruptions. Base Chemicals reported a 1% decrease in sales volumes mainly due to production interruptions at SSO and a stock build for our high density polyethylene joint venture in the US. Excluding the impact of Eskom electricity supply interruptions, sales volumes increased by 1%. Liquid fuels sales volumes were down 2% due to lower volumes from SSO and Natref and a challenging South African retail liquid fuels market.
Turning to our cost performance, cash fixed costs were up 2% in real terms in the first half of the year mainly as a result of abovementioned planned and unplanned production interruptions. In the second half of the year, we increased our focus on improving our cost efficiency and managed to keep our normalised cash fixed costs (excluding growth and once-off items) for the year flat in real terms. We are of the view that our cost management processes remain robust to protect and improve our cost competitive position and still positions us in managing our cost base to within our inflation target, while ensuring that we maintain safe and sustainable operations.
Tax exposures which could impact our earnings
We have two significant tax disputes with South African Revenue Service (SARS) currently in respect of our crude oil procurement process for Sasol Oil (Pty) Ltd and Sasol Financing International Plc (SFI), our offshore treasury company. Both disputes are at different stages of the tax litigation process as Sasol does not, supported by expect advice, agree with the basis of these additional assessments. Further details of these disputes are provided in note 12 of our Annual Financial Statements
Managing cash and capital
Free cash flow generation is one of the most important drivers of sustaining and increasing shareholder value. Our free cash flow reduced from R11,3 billion in 2017 to R6,6 billion in 2018 mainly due to the significant capital expenditure in the year of R53,4 billion, of which R30,1 billion related to the LCCP.
Cash generated by operating activities
Cash generated by operating activities decreased 3% to R42,9 billion compared with R44,1 billion in the prior year. This is largely attributable to a R3,8 billion increase in working capital. Our trade receivables increased by R2,8 billion due to higher chemical sales prices and higher volumes in June 2018 which translated into cash in July 2018. Inventory increased by R3,4 billion mainly as a result of higher feedstock costs as a result of the increase in crude oil prices compared to the previous financial year. Inventory holding in days were slightly higher compared to the previous financial year.
Additions to non-current assets (including capital accruals) (R billion)

Capital investments
Over the past three years, we have made capital investments of R184 billion, of which R53,4 billion was invested in 2018. We focused our investment mainly in projects in South Africa, Mozambique and the United States, with some investments in Germany and China. In 2018, R34 billion related to growth capital, mainly the LCCP and R19 billion related to sustenance capital to ensure safe and reliable operations.
Our capital investment in South Africa was R18 billion in 2018, which is approximately 35% of the total capital investment for the year. Further details of additions to our non-current assets is provided in notes 17 and 18 of our Annual Financial Statements.
Cash utilisation
In 2018, the cash outflow of our capital investment programme exceeded the cash retained from operating activities by R27 billion.
Managing our funding plan, debt profile and credit rating
Cash utilisation (R billion)

Debt profile
Debt profile Our long-term capital expansion projects are financed by a combination of floating and fixed-rate long-term debt, as well as internally generated funds. We endeavour to match debt to the currency of the underlying revenue generation. Further details of how we manage our capital structure is included on page 20.
Net debt increased by R40 billion in 2018 to R96 billion mainly due to the funding of the LCCP and the higher valuation of US dollar debt funding at year end. Our debt was made up as follows:
| 2018 | 2017 | 2016 | ||||
| Long-term debt | 109 454 | 81 405 | 79 877 | |||
|---|---|---|---|---|---|---|
| Short-term debt | 1 946 | 2 625 | 138 | |||
| Bank overdraft | 89 | 123 | 136 | |||
| Total debt | 111 489 | 84 153 | 80 151 | |||
| Less cash (excluding cash restricted for use) | 15 148 | 27 643 | 49 985 | |||
| Net debt/(cash) | 96 341 | 56 510 | 30 166 |
We are actively reviewing our capital structure and funding plan to ensure that we maintain an optimum solvency and liquidity profile. The unwinding of the Inzalo transaction has been structured to ensure that our credit ratings are maintained at investment grade and with the least amount of dilution to our shareholders. The Board approved that Sasol repurchase the shares from Inzalo Public and settle the outstanding debt of R7,4 billion and a cash top-up for value realised of approximately R600 million in September 2018, assuming a share price of R500. This step will eliminate any shareholder dilution as a result of the unwind of the Sasol Inzalo B-BBEE structure.
Our debt profile at 30 June analysed by currency was:
| 2018 | % | 2017 | ||||
| Rand | 19 044 | 17 | 20 922 | |||
| US dollar | 91 131 | 82 | 59 391 | |||
| Euro | 530 | – | 3 063 | |||
| Other | 784 | 1 | 777 | |||
| 111 489 | 100 | 84 153 |
|---|
Due to the funding of the LCCP, more than 80% of our debt is now US dollar denominated. Given the significantly weaker closing exchange rate of R13,73 and the related translation loss of R4,8 billion arising on the valuation of the balance sheet at year-end, gearing increased to 43,2%, which is slightly below our internal ceiling and market guidance. Included in net debt is R6,1 billion of new finance leases mainly relating to Oxygen Train 17 in Secunda and rail storage facilities at the LCCP.
Net debt: EBITDA (times)

Looking forward, we expect a significant cash contribution from the LCCP and our balance sheet to deleverage by at least 2021. However, to fund our future growth ambitions, we aim to have a gearing ratio of at least 30%. This will mean having to source the appropriate funding mix at the most attractive rates in the market. We have implemented a dynamic funding plan which is based on our latest assumptions and capital requirements. We review the plan on an ongoing basis and report on it to the Audit Committee to ensure that we have sufficient liquidity and headroom on the balance sheet in the foreseeable future.
| * | The Board has temporarily lifted our internal gearing ceiling to 44% until the end of the 2018 financial year. Net debt: EBITDA will be managed to below 2,0 times. |
Solvency and liquidity
The Group meets its financing requirements through a mixture of cash generated from its operations and short- and long-term borrowings. We maintain adequate banking facilities and reserve borrowing capacities. Sasol is in compliance with all of the financial covenants of its loan agreements, none of which is expected to present a material restriction on funding or its investment policy in the near future. We believe that cash on hand and funds from operations, together with our existing borrowing facilities, will be sufficient to cover our working capital and debt service requirements in the year ahead.
Credit ratings
Our credit rating is influenced by some of our more significant risks. These include crude oil price volatility, movements in the sovereign credit rating of South Africa, our investments in developing countries and their particular associated economic risks, the potential for significant debt increase and the execution challenges associated with a number of our planned growth projects if they materialise simultaneously, as well as the risks arising from potential increases in capital costs associated with these projects. In January 2018, S&P Global Ratings affirmed Sasol’s credit rating at a BBB-/A-3 with a stable outlook. This is two notches above the South African sovereign credit rating and is at investment grade. Similarly Moody’s Investors Service (Moody’s) confirmed South Africa’s Baa3 changing the rating from negative to stable in March 2018, while affirming Sasol’s global scale long-term issuer ratings at Baa3, adjusting the outlook from negative to stable. Sasol’s national scale long-term rating was affirmed at Aaa.za. Moody’s has delinked Sasol from the South African sovereign rating by one notch.
Analysing our shareholding and returns to shareholders
Shareholding
Sasol’s shareholder base consists primarily of large institutional shareholders, with varying investment styles, concentrated in South Africa. With the LCCP coming on line, our international portfolio is becoming more significant. As a result, our aim is to achieve a broad correlation between the distribution of our shareholder base and the sources of cash-generation for the Sasol Group. This means that we will specifically target a larger number of US-based investors in future.
Total shareholder return
We return value to our shareholders by way of both dividends and share price appreciation. Total shareholder return (TSR) is a measure of the performance of the Group’s shares over time, and combines both share price appreciation and dividends paid to indicate the total return to a shareholder over the period. Sasol’s TSR for the five-year period ending 30 June 2018 was 40% in rand terms and 1% in US dollar terms.
The performance of the share price was influenced by a combination of factors such as market sentiment, the volatile rand/US dollar exchange rate due to political uncertainty and global impacts. The steady increase of the crude oil price and the LCCP coming online increased the market interest in Sasol which further contributed to the share price performance.
To maximise TSR, the Group has put measures in place to:
- refine our strategy setting a clear path to deliver sustainable value-based growth;
- define a disciplined capital allocation framework for improving shareholder returns;
- improve project execution by implementing lessons learnt from previous projects;
- actively manage the balance sheet to address external volatility;
- focus on Continuous Improvement to address the structural shift in the energy landscape by improving the efficiency of our operations; and
- work with government and other stakeholders to manage the impact of regulations on Sasol’s South African business.
Dividends
Our dividend policy is to pay dividends within a dividend cover range based on Core HEPS. Taking into account the impact of the current volatile macroeconomic environment, capital investment plans, the current gearing range of 43,2%, and the dividend cover range, the Board has declared a gross final dividend of R12,90 per ordinary share and Sasol BEE ordinary share. The dividend cover was 2,8 times at 30 June 2018. The dividend demonstrates our commitment to return value to shareholders through dividend payments.
Outlook for 2019
The current economic climate continues to remain highly volatile and uncertain. While oil price and foreign exchange movements are outside our control and may impact our results, our focus remains firmly on managing factors within our control, including volume growth, cost optimisation, effective capital allocation, focused financial risk management and maintaining an investment grade credit rating.
We expect an overall strong operational performance for 2019, with:
- SSO volumes of between 7,6 to 7,7 million tons due to a planned full shutdown in 2019;
- Liquid fuels sales of approximately 57 to 58 million barrels due to a planned full shutdown at SSO;
- Base Chemicals sales volumes, excluding US produced products, to be 2% – 3% higher than the prior year, with US dollar product pricing expected to follow Brent crude oil prices. Our US HDPE plant will contribute for the full year, while LCCP is expected to start contributing during the second half of the year;
- Performance Chemicals sales volumes to be 2% – 4% higher, excluding the LCCP;
- Gas production volumes from the Petroleum Production Agreement in Mozambique to be between 114 bscf to 118 bscf;
- We expect to achieve an average utilisation rate of 95% at ORYX GTL in Qatar;
- Normalised cash fixed costs to remain in line within our inflation assumption of 6%;
- Capital expenditure, including capital accruals, of R38 billion for 2019 and R30 billion for 2020 as we progress with the execution of our growth plan and strategy. Capital estimates may change as a result of exchange rate volatility and other factors;
- Our balance sheet gearing to range between 40% – 44%;
- Rand/US dollar exchange rate to range between R12,50 and R13,50; and
- Average Brent crude oil prices to remain between US$65/bbl and US$75/bbl.
Appreciation
I would like to thank my colleagues on the Board and the Group Executive Committee for their support and leadership during this challenging year. I also wish to express my appreciation for the dedication and hard work of our finance teams across the group. Finally, I would like to thank our shareholders for their interest and investment in Sasol.
Paul Victor
Chief Financial Officer
27 August 2018
Financial statement analysis
at 30 June
| 2018 Rm |
2017 Rm |
2016 Rm |
||||
| ASSETS | ||||||
|
|
167 457 | 158 773 | 155 054 | |||
|
|
165 361 | 130 734 | 104 011 | |||
| Goodwill and other intangible assets | 2 687 | 2 361 | 2 680 | |||
| Equity accounted investments | 10 991 | 11 813 | 13 118 | |||
| Post-retirement benefit assets | 1 498 | 622 | 614 | |||
| Deferred tax assets | 4 096 | 3 082 | 3 389 | |||
| Other long-term assets | 5 888 | 3 600 | 3 715 | |||
| Non-current assets | 357 978 | 310 985 | 282 581 | |||
| Assets in disposal groups held for sale | 113 | 216 | 1 064 | |||
| Other short-term assets | 85 | – | – | |||
|
|
29 364 | 25 374 | 23 798 | |||
| Trade and other receivables | 33 031 | 30 179 | 30 913 | |||
|
|
1 536 | 2 739 | 42 | |||
| Cash restricted for use | 1 980 | 1 803 | 2 331 | |||
| Cash and cash equivalents | 15 148 | 27 643 | 49 985 | |||
| Current assets | 81 257 | 87 954 | 108 133 | |||
| Total assets | 439 235 | 398 939 | 390 714 | |||
| EQUITY AND LIABILITIES | ||||||
| 222 985 | 211 711 | 206 997 | ||||
| Non-controlling interests | 5 623 | 5 523 | 5 421 | |||
| Total equity | 228 608 | 217 234 | 212 418 | |||
| 96 691 | 74 312 | 78 015 | ||||
| Long-term provisions | 15 160 | 16 648 | 18 810 | |||
| Post-retirement benefit obligations | 11 900 | 11 069 | 12 703 | |||
| Long-term deferred income | 879 | 910 | 631 | |||
| Long-term financial liabilities | 133 | 733 | 2 844 | |||
| Deferred tax liabilities | 25 908 | 25 860 | 23 691 | |||
| Non-current liabilities | 150 671 | 129 532 | 136 694 | |||
| Liabilities in disposal groups held for sale | 36 | – | – | |||
| Short-term debt | 14 709 | 9 718 | 2 000 | |||
| Short-term financial liabilities | 1 926 | 740 | 855 | |||
| Other current liabilities | 43 196 | 41 592 | 38 611 | |||
| Bank overdraft | 89 | 123 | 136 | |||
| Current liabilities | 59 956 | 52 173 | 41 602 | |||
| Total equity and liabilities | 439 235 | 398 939 | 390 714 |
Commentary
ADDITIONS TO ASSETS
Capital expenditure, including accruals, amounted to R53,4 billion. This includes R30,1 billion (US$2,3 billion) relating to the LCCP. The capital spending rate is aligned to our internal targets and with previous market guidance provided.
IMPAIRMENT OF ASSETS
Included in remeasurement items is a partial impairment of R5,2 billion on our South African Chlor Vinyls cash generating unit, an impairment on our Canadian shale gas assets of R2,8 billion, a partial impairment of R1,1 billion (US$94 million) on the Production Sharing Agreement (PSA) in Mozambique and scrapping of our US GTL project amounting to R1,1 billion (US$83 million).
WORKING CAPITAL
A R3,8 billion increase in working capital. Our trade receivables increased by R2,8 billion due to higher chemical sales prices and higher volumes in June 2018 which translated into cash in July 2018. Inventory increased by R3,4 billion mainly as a result of higher feedstock costs as a result of the increase in crude oil prices compared to the previous financial year.
EQUITY
Shareholders’ equity benefited from earnings in the year net of dividends.
DEBT
Due to the funding of the LCCP, more than 80% of our debt is now US dollar denominated. Included in net debt is R6,1 billion of new finance leases relating to the Oxygen Train 17 in Secunda and rail storage in the US.
Non-current assets
R358 bn
Current assets
R81 bn
Total assets
R439 bn
Income statement
for the year ended 30 June
| 2018 Rm |
2017 Rm |
2016 Rm |
||||
|
|
181 461 | 172 407 | 172 942 | |||
|---|---|---|---|---|---|---|
| Materials, energy and consumables used | (76 606) | (71 436) | (71 320) | |||
| Selling and distribution costs | (7 060) | (6 405) | (6 914) | |||
| Maintenance expenditure | (9 163) | (8 654) | (8 453) | |||
|
|
(27 468) | (24 417) | (23 911) | |||
| Exploration expenditure and feasibility costs | (352) | (491) | (282) | |||
| Depreciation and amortisation | (16 425) | (16 204) | (16 367) | |||
| Other expenses and income | (15 316) | (12 550) | (9 073) | |||
| Translation (losses)/gains | (11) | (1 201) | 150 | |||
| Other operating expenses and income | (15 305) | (11 349) | (9 223) | |||
| Equity accounted profits, net of tax | 1 443 | 1 071 | 509 | |||
| Operating profit before remeasurement items and Sasol Khanyisa share-based payment | 30 514 | 33 321 | 37 131 | |||
|
|
(9 901) | (1 616) | (12 892) | |||
| Sasol Khanyisa shared-based payment | (2 866) | – | – | |||
| Earning before interest and tax (EBIT) | 17 747 | 31 705 | 24 239 | |||
| Finance income | 1 716 | 1 568 | 1 819 | |||
| Finance costs | (3 759) | (3 265) | (2 340) | |||
| Earning before tax | 15 704 | 30 008 | 23 718 | |||
| (5 558) | (8 495) | (8 691) | ||||
|
|
10 146 | 21 513 | 15 027 | |||
| Attributable to | ||||||
| Owners of Sasol Limited | 8 729 | 20 374 | 13 225 | |||
| Non-controlling interests in subsidiaries | 1 417 | 1 139 | 1 802 | |||
| 10 146 | 21 513 | 15 027 |
| Per share information | Rand | Rand | Rand | ||
| Basic earnings per share | 14,26 | 33,36 | 21,66 | ||
|---|---|---|---|---|---|
| Diluted earnings per share | 14,18 | 33,27 | 21,66 |
Commentary
TURNOVER
Total turnover up by 5%. Mining's, Energy's, Base and Performance Chemicals turnover were up by 17%, 8%, 5% and 4% respectively.
EMPLOYEE-RELATED EXPENDITURE
Excluding the impact of the share-based payment, our employee costs increased by 7% compared to 2017. Mainly due to normal salary increase and 370 employees were employed by the organisation mainly in the US and the in-sourcing and the conversion of hired employees to permanent employees.
REMEASUREMENT ITEMS
Most significant remeasurement items include as a partial impairment of R5,2 billion on our South African Chlor Vinyls cash generating unit, an impairment on our Canadian shale gas assets of R2,8 billion, a partial impairment of R1,1 billion (US$94 million) on the Production Sharing Agreement (PSA) and scrapping of our US GTL project amounting to R1,1 billion (US$83 million).
TAXATION
Our effective corporate tax rate increased from 28,3% to 35,4% largely as a result of impairments relating to our shale gas assets in Canada (R2,8 billion) and the Production Sharing Agreement (PSA) in Mozambique (R1,1 billion) as well as the sharebased payment expense (R3 billion) with the implementation of Sasol Khanyisa.
EARNINGS ATTRIBUTABLE TO SHAREHOLDERS
Earnings attributable to shareholders for the year ended 30 June 2018 decreased by 57% to R8,7 billion from R20,4 billion in the prior year. The stronger average rand/US dollar exchange rate and the negative impact of remeasurement items, largely driven by the stronger longer-term rand exchange rate, resulted in a much lower profit and earnings per share for the financial year.
Earnings before interest and tax
R17,7 bn
Earnings before tax
R15,7 bn
Earnings per share
R14,26
Statement of cash flows
for the year ended 30 June
| 2018 Rm |
2017 Rm |
2016 Rm |
|||||
| Cash receipts from customers | 178 672 | 172 061 | 175 994 | ||||
|---|---|---|---|---|---|---|---|
| Cash paid to suppliers and employees | (135 795) | (127 992) | (121 321) | ||||
| Cash generated by operating activities | 42 877 | 44 069 | 54 673 | ||||
| Dividends received from equity accounted investments | 1 702 | 1 539 | 887 | ||||
| Finance income received | 1 565 | 1 464 | 1 633 | ||||
| Finance costs paid | (4 797) | (3 612) | (3 249) | ||||
| Tax paid | (7 041) | (6 352) | (9 329) | ||||
| Cash available from operating activities | 34 306 | 37 108 | 44 615 | ||||
| Dividends paid | (7 952) | (8 628) | (10 680) | ||||
| Cash retained from operating activities | 26 354 | 28 480 | 33 935 | ||||
| Total additions to non-current assets | (55 891) | (56 812) | (70 497) | ||||
|
|
(53 384) | (60 343) | (73 748) | ||||
| (Decrease)/increase in capital project-related payables | (2 507) | 3 531 | 3 251 | ||||
| Additional cash contributions to equity-accounted investments | (164) | (444) | (548) | ||||
| Proceeds on disposals and scrappings | 2 280 | 788 | 569 | ||||
| Purchase of investments | (124) | (96) | (223) | ||||
| Other net cash flow from investing activities | (80) | (113) | (335) | ||||
| (Increase)/decrease in long-term receivables | (194) | (141) | (506) | ||||
| Cash used in investing activities | (53 979) | (56 677) | (71 034) | ||||
| Share capital issued on implementation of share options | – | – | 54 | ||||
| Dividends paid to non-controlling | |||||||
| shareholders in subsidiaries | (725) | (989) | (1 296) | ||||
|
|
24 961 | 9 277 | 34 008 | ||||
|
|
(9 199) | (2 364) | (3 120) | ||||
|
|
1 957 | 4 033 | 2 901 | ||||
|
|
(2 607) | (1 410) | (3 369) | ||||
| Cash generated by financing activities | 14 387 | 8 547 | 29 178 | ||||
| Translation effects on cash and cash equivalents | 954 | (3 207) | 7 069 | ||||
| (Decrease)/increase in cash and cash equivalents | (12 284) | (22 857) | (852) | ||||
| Cash and cash equivalents at beginning of year | 29 323 | 52 180 | 53 032 | ||||
|
|
17 039 | 29 323 | 52 180 |
Commentary
ADDITIONS TO NONCURRENT ASSETS
Capital expenditure, including accruals, amounted to R53,4 billion. This includes R30,1 billion (US$2,4 billion) relating to the LCCP.
PROCEEDS FROM LONG-TERM DEBT
Loans raised during the year amounted to R26,9 billion, mainly for the funding of our US growth project.
CASH AND CASH EQUIVALENTS
Our net cash position decreased by 42%, from R29,3 billion in the prior period to R17 billion as at 30 June 2018 due to the funding of the LCCP and investments to fund growth project
Cash generated by operating activities
R43 bn